Please wait...

Please wait...


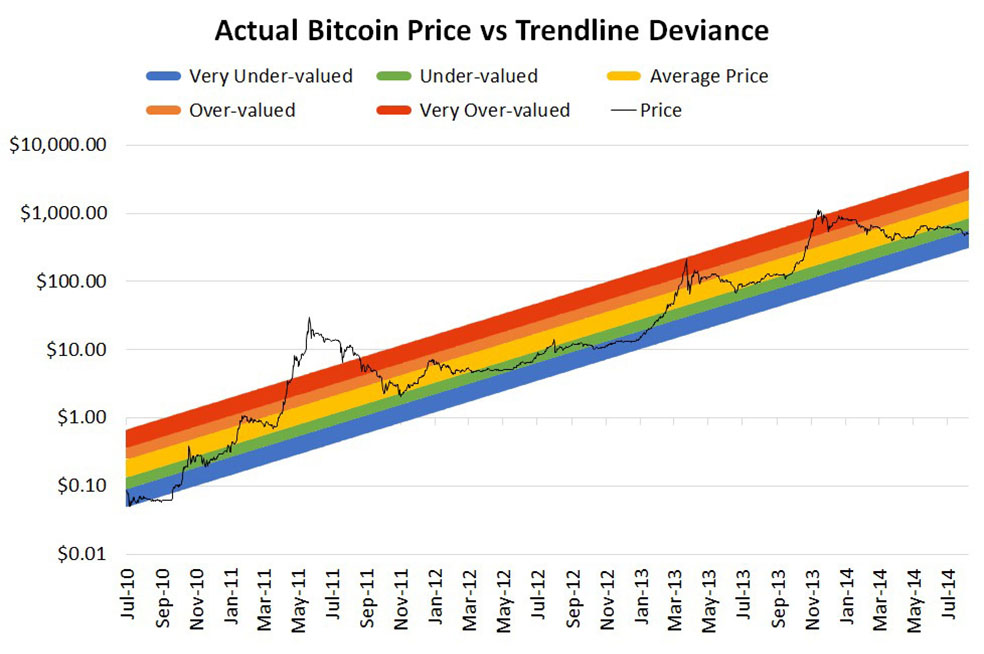
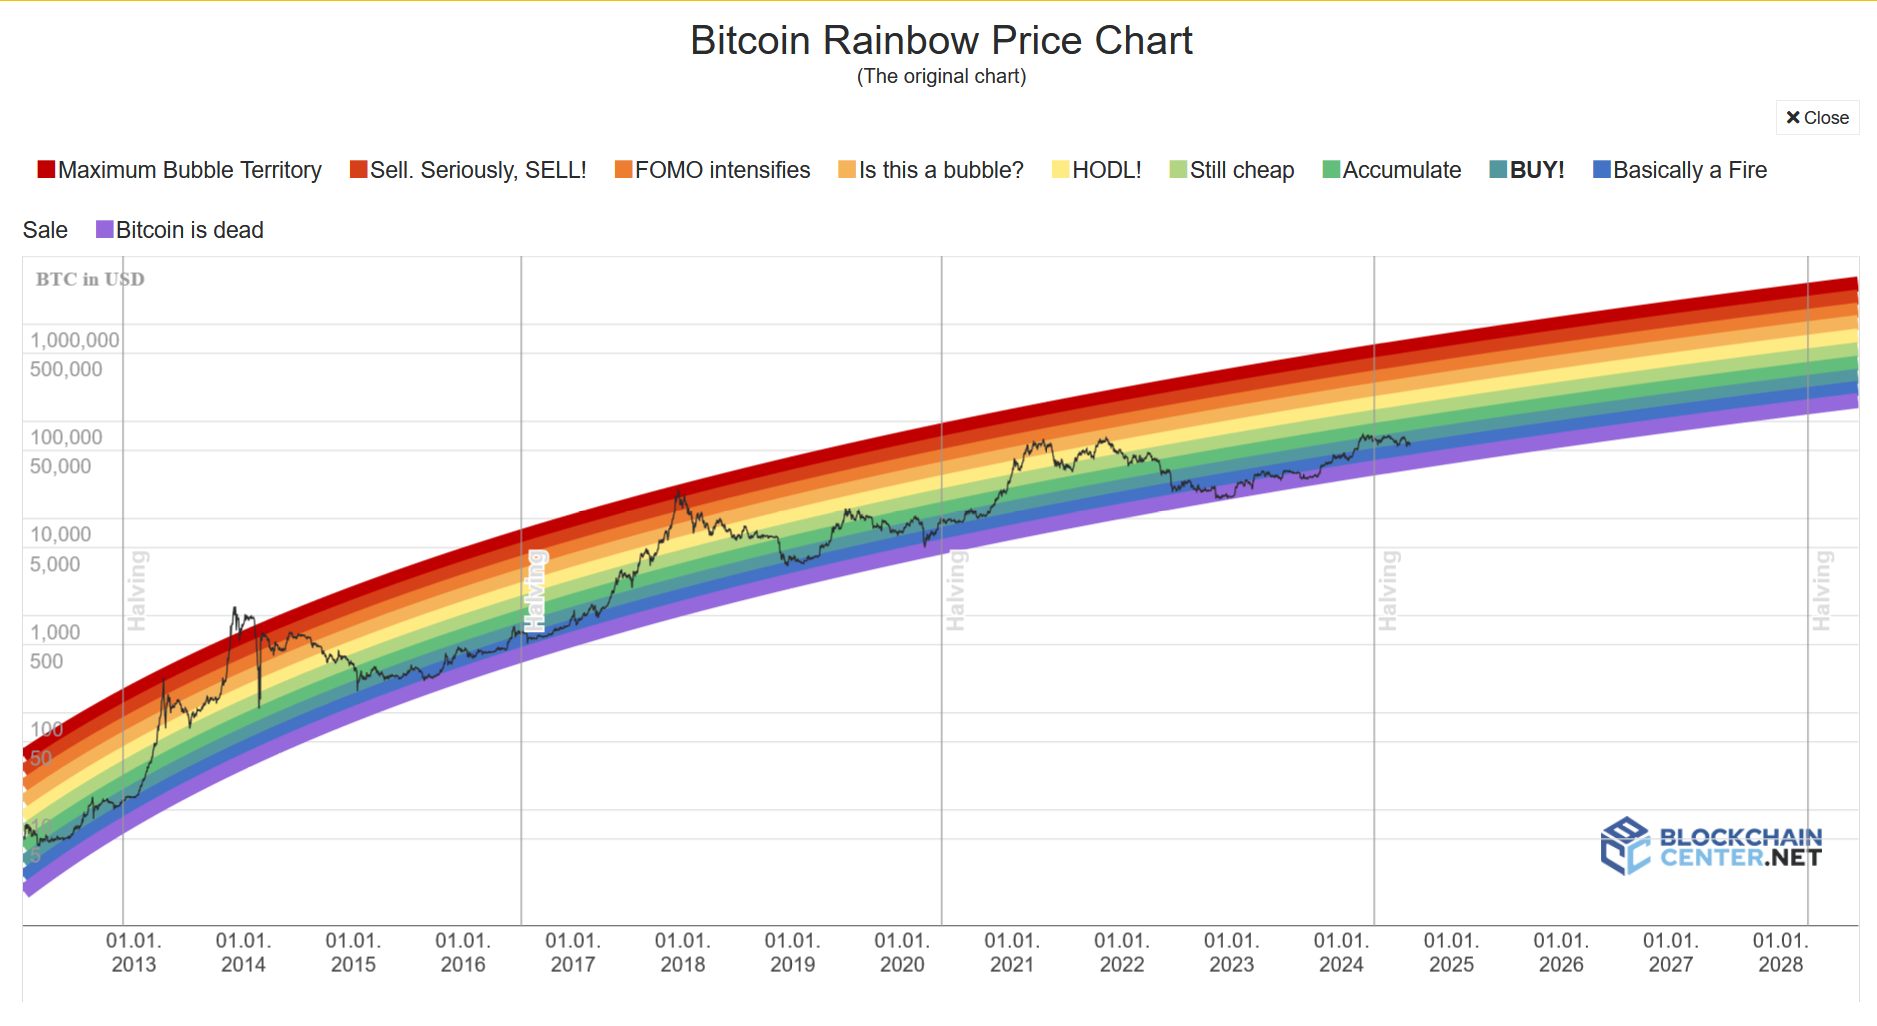
The chart uses a color-coded spectrum to denote different price ranges, providing an easy-to-read visual of bitcoin's current position compared to past trends
The Bitcoin Rainbow Chart can be used to recognize potential phases of high and low value based on the current bitcoin price within the color bands
The Bitcoin Rainbow Chart is a tool that plots bitcoin's long-term price movement on a logarithmic scale. Each color band on the chart represents a different price range, with blue being the lowest and dark red the highest.
This color-coded spectrum provides a visual representation of bitcoin's current position compared to past trends, making it easier for users to understand the market's behavior.
Cryptocurrencies are known for their volatility, with values that can rise and plunge within a few hours. However, the Bitcoin Rainbow Chart helps users navigate this volatility by providing a long-term view of bitcoin's price evolution.
The chart divides bitcoin's ascent into different price phases, represented by the colors of the rainbow. When bitcoin is in the blue/green zone, it's recognized as a phase where the asset's value is comparatively low.
Conversely, when the price is in the orange and red zones, it's recognized as a phase where the asset's value is comparatively high.
The Bitcoin Rainbow Chart consists of nine color bands, each representing a different layer of Bitcoin's market cycle.
The blue band, for example, signifies a significant dip or correction in the market, suggesting a phase of recovery from a dip. The blue-green zone represents a slight recovery from a dip, indicating a phase where BTC is trading at a fair value.
While the Bitcoin Rainbow Chart provides a historical context and a visual representation of different market phases, it's not a foolproof indicator for predicting BTC's future price movements.
Its accuracy is limited by historical data and assumptions, and the color bands don't reflect the current market state or future price expectations with certainty.
Therefore, it should be used in conjunction with other indicators and analysis methods as a reference point to make informed decisions.
The Bitcoin Rainbow Chart also takes into account Bitcoin Halving, which occurs every four years. This event reduces the amount of tokens mined by half, creating scarcity and potentially influencing demand for Bitcoin.
This phenomenon has the potential to influence price movements that peak in the red zone, before the market undergoes a correction, bringing the price back down.

"Currently, Bitcoin is in the 'Fire Sale' price range on the Rainbow Chart, indicating a market discount!"
"But it should be considered that The Rainbow Charts are not investment advice! Past performance is not an indication of future results. You can not predict the price of Bitcoin with a rainbow! It is meant to be be a fun way of looking at the historical long term price movements, disregarding the daily volatility “noise”. There is no scientific basis underpinning it.